The AI Adoption Curve at Your Company Is Not Measuring What You Think
Wanting to do something is one thing, being able to is another, and actually doing it are a few more things entirely.
Nikolay Haytov
Somewhere in your company there is a slide. It has a bell curve on it. The bell curve is labelled with the sacred words of Everett Rogers - innovators, early adopters, early majority, late majority, laggards - and a little arrow suggesting that your organisation is currently "crossing the chasm". Next to it is a proud number, something like 73% of employees have activated their AI licence.
The implied story is comforting. Adoption is a matter of time. People move through the curve in an orderly procession, like penguins at a buffet, and once they have "adopted", they adopt roughly as much as everyone else. The tool gets used. Value gets created. The only remaining question is how to nudge the last 27%, presumably with a mandatory webinar.
The Question
If 73% of the company has adopted, why does nearly all the measurable value - the automated reports, the reused prompts, the workflows that quietly replaced a vendor - come from the same eleven people?
And why is one of them an intern?
The Explanation
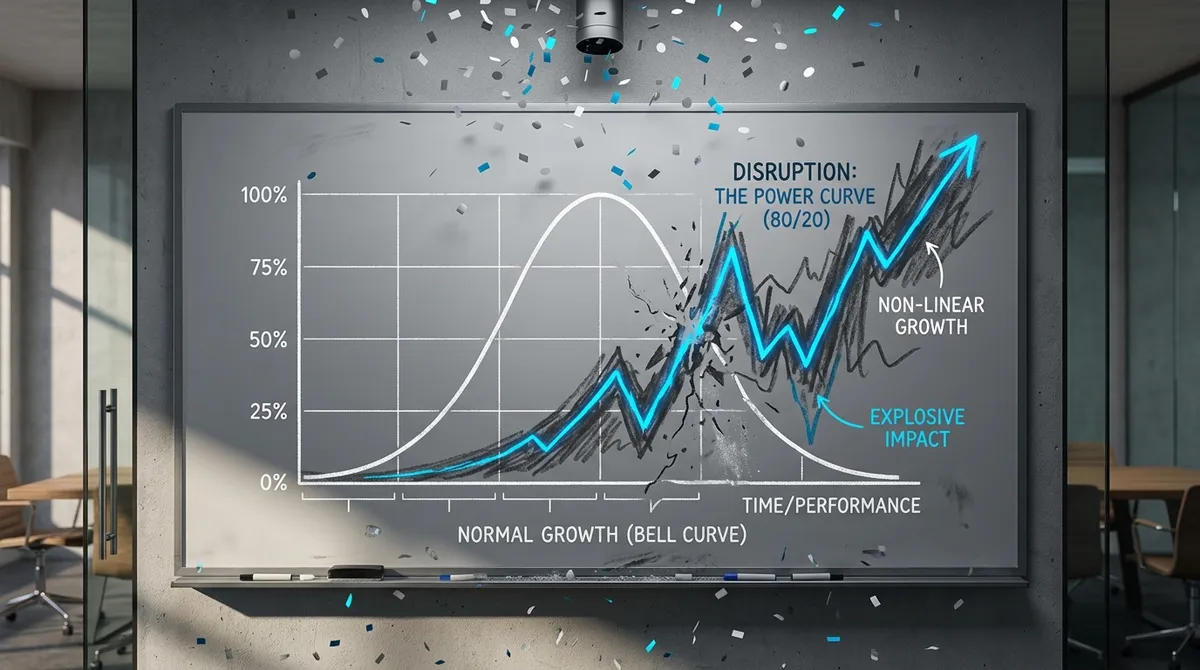
Because you are looking at two different curves and calling them the same thing. The bell curve describes whether someone touched the tool. The power curve describes how much they got out of it. The first is a question of logins. The second is a question of leverage, and leverage in organisations is never distributed normally. It is distributed the way wealth, citations, city sizes, and viral tweets are distributed - a tiny head doing almost everything, and a very long tail doing almost nothing. Your 73% is real. It just contains a median user who asked the model to write a birthday message in March and has not been back since.
To see why, it helps to meet two of the people hiding inside that number.
Meet Priya. Priya works in finance operations and has no title that suggests she should matter to the AI strategy. In the first week after rollout she built a prompt that reconciles two exports. In week three she chained it to a second prompt that drafts the variance commentary. By month two, three teams were using her chain, and she had become the person people Slack when the model "does something weird". Nobody appointed Priya. She simply started compounding earlier than everyone else and never stopped. Meanwhile, Dave in procurement, who also "adopted" the tool according to the dashboard, used it to rephrase an email so it sounded less angry. It worked. He has not needed it since.
Priya and Dave are not two points on the same bell curve. They are two points on a power law, and a power law is a very different animal. It is a distribution where the probability of a value falls off as a power of that value, roughly P(x) proportional to x to the minus alpha. The practical consequence is that there is no "typical" user. In a normal distribution, the mean, median, and mode huddle together and most observations sit near them. In a power law, the top few percent can account for the majority of the total, and the distribution has no meaningful center. The famous 80/20 rule is just one point on this family of curves - the specific case where alpha is a little over one. Your company's usage data almost certainly has an alpha, and if you plotted it on log-log axes it would look depressingly like a straight line, which is the mathematical equivalent of the universe shrugging.
The universe shrugged, and then the quarterly all-hands happened anyway. The Chief Transformation Officer announces that the AI program is "ahead of plan" and shows the 73% number again, now with confetti. Priya is in the audience, slightly tired, because she has been doing unpaid internal consulting for six weeks. Dave is also in the audience and applauds, because he too is part of the 73% and feels, in a vague way, that he is on the frontier. The slide does not distinguish between them. The slide cannot distinguish between them, because the slide is measuring the wrong variable with great precision.
It would be tempting to conclude that Priya is simply gifted and Dave is simply Dave. That is not what the shape of the curve is telling you. Power laws are not caused by some people being innately magical. They are the signature of multiplicative processes with feedback. Each time Priya builds a prompt, her next prompt is easier to build, her reputation for building prompts attracts more problems to solve, and the problems make her better. This is preferential attachment, the same mechanism that gives you a handful of enormous websites and a billion ignored ones. Returns to skill are not additive, they are compounding, and compounding over a population with slightly different starting conditions produces heavy tails every single time. The distribution is not a judgement about talent. It is what happens when you let a feedback loop run for two quarters and then act surprised.
Surprise, in a large organization, tends to be routed to HR, and HR responds the way HR responds to everything, with training. Every employee receives the same four-hour course, "Prompting Fundamentals for Everyone", delivered by someone who learned about transformers in a different four-hour course. Dave attends and learns that he can ask the model to "act as an expert". Priya attends because attendance is tracked, and spends the session building a second workflow under the desk. Afterwards, the adoption metric rises to 81%. The eleven people are still the eleven people. Dave sends one more email, now with the model acting as an expert in emails.
The program will nonetheless report a healthy "average hours saved per employee", and this is where averages become actively dangerous. In a heavy-tailed distribution, the mean is dominated by the tail, so that number describes nobody. Take the eleven out of the sample and the mean collapses. Add one more Priya and it doubles. The median user, by contrast, is Dave, and Dave's number is approximately zero. When leadership reports an average, they are unknowingly reporting the tail divided by the headcount, which is a bit like calculating the average net worth of a bar the moment a billionaire walks in and concluding that everyone should be able to afford the drinks and (proven by math) the bar itself. Uniform training targets the median. The median is not where the value is, and it is not where the value is going to come from.
Which means the useful question is not "how do we get to 90%". It is "who are the eleven, what did they actually build, and why is one of them an intern". The intern matters because she falsifies the org chart theory of adoption. She is not senior. She is not in IT. She just had a boring task, no fear of looking stupid, and nobody watching. Finding the eleven is cheap. They are already known - they are the people everyone else quietly asks for help. Asking them what they built, and then making that reusable for Dave, is the entire program. The rest is confetti.
Taking that seriously means abandoning adoption rate as a headline and replacing it with distributional metrics. Plot the Lorenz curve of usage - cumulative share of value against cumulative share of users - and report the Gini coefficient. Report what share of value comes from the top 5% and whether that share is shrinking, because a shrinking tail share means the body is absorbing the head's work. Track reuse, not sessions - a prompt used by forty people is worth more than forty people each sending one prompt. And resist the fantasy of flattening the curve. You will not turn a power law into a bell curve by policy, because the feedback loops that create it are the same ones that make the tool useful. You can lower alpha a little - make it easier to enter the tail - and you can build pipes that carry what the tail makes to everyone else. That is the whole trick. Institutional leverage is individual leverage with plumbing.
So the next time the slide comes out, look past the bell curve. The real shape of AI at your company is a cliff, a ledge, and a very long, very flat beach. The strategic question was never how many people are standing on the beach. It is how to get the eleven people on the cliff to throw ropes down, and how to pay them for the rope.
And yes, the intern should probably be promoted.