Observing at One Wavelength
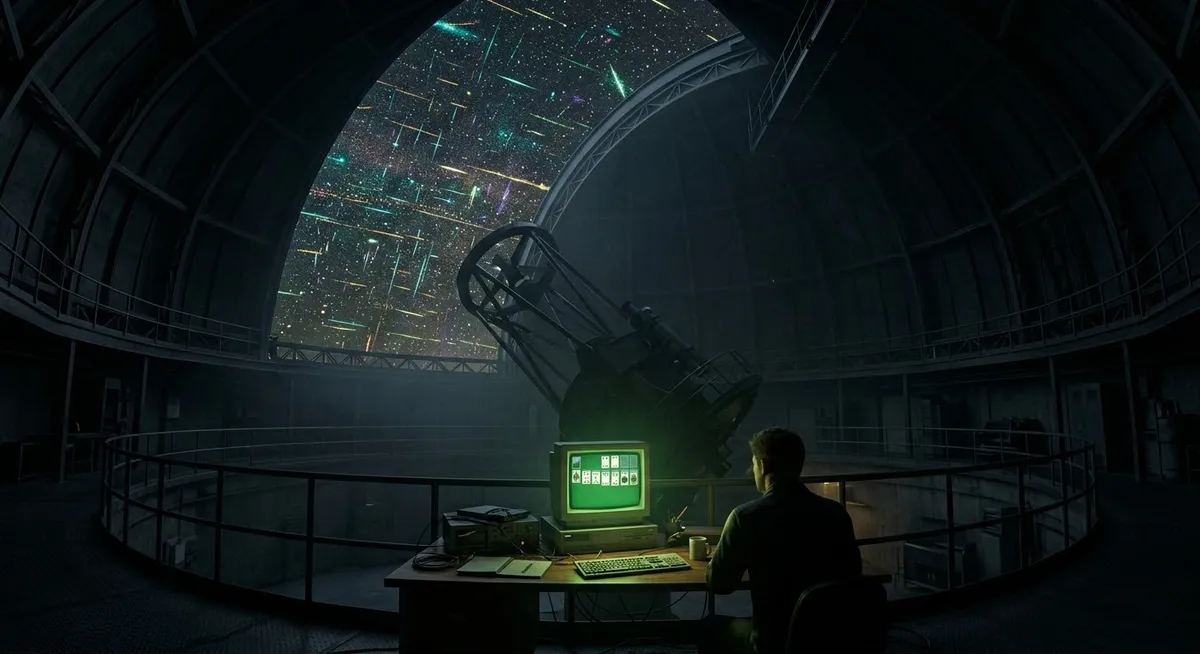
For most of human history, astronomy meant looking. Eyes, then lenses, then mirrors, then glass plates bolted to bigger mirrors. The instruments got magnificent. The band never moved. We surveyed the entire universe through a slot roughly three hundred nanometres wide, declared the catalogue essentially complete, and settled in to argue about the decimal places.
The universe, meanwhile, was doing nearly all of its interesting work somewhere else.
The sky was never quiet, we were
In 1932 Karl Jansky was paid by Bell Labs to hunt down the static ruining transatlantic radiotelephone calls. He found a hiss that rose and fell with the sidereal day rather than the solar one, which is a polite way of saying that something in Sagittarius was screaming continuously and had been for the entire duration of recorded human civilisation. The astronomical establishment greeted this news with the enthusiasm of a homeowner informed that his house has a basement. Interesting. Perhaps later.
What followed, once war surplus radar hardware made radio astronomy cheap, was less a series of discoveries than a mass eviction from complacency.
- Quasars. 3C 273 sat on optical plates for decades, catalogued as a faint blue star of no particular consequence. In the radio band it was one of the loudest objects in the sky, and it turned out to be a galactic core outshining its entire host galaxy from a region smaller than the solar system.
- Pulsars. Found in 1967 as periodic "scruff" on a chart recorder, initially suspected of being interference from a badly earthed building, then briefly and privately labelled LGM for Little Green Men, because when your instrument shows you something impossible the first hypothesis is always that the instrument is broken and the second is aliens. Optically, most pulsars are nothing. The Crab pulsar flashes thirty times a second and a long exposure renders it a dull grey smudge.
- The cosmic microwave background. Penzias and Wilson spent months chasing an excess noise temperature they could not eliminate, up to and including evicting pigeons from the horn antenna and scrubbing out what the literature delicately calls a white dielectric substance. The residual they could not clean away was the afterglow of the origin of everything. It had been arriving at the Earth without interruption the whole time, at every point in the sky, and we had spent four hundred years of telescope building never once pointed at the right part of the spectrum to notice.
- X-ray sources. Scorpius X-1 was found in 1962 by an instrument on a sounding rocket, because the atmosphere that lets starlight through is opaque to X-rays. Everything violent, hot and compact in the universe was invisible from the ground by geological accident.
- Gamma ray bursts. Detected by Vela satellites built to catch Soviet nuclear tests. The most energetic explosions known to physics were discovered as a side effect of arms control, and then classified for years, because the people with the only working detector were not looking for astronomy and did not recognise what they had.
The pattern is uncomfortable and worth naming plainly. Every one of these phenomena was continuously present, in principle detectable, and completely absent from a mature, confident, well funded observational programme, for the sole reason that the programme observed at one wavelength. Not because anyone chose to be narrow. Because the atmosphere is transparent in the visible band, our eyes evolved to exploit that transparency, and every instrument we built afterwards flattered our eyes.
You inherit your blind spots. Then you industrialise them.
Green is a colour, not a guarantee
Substitute your own field and the story keeps its shape. A monitoring stack. A quarterly metrics review. A test suite. A survey instrument. A performance management framework. Anything that has become the way we know how things are going.
The dashboard is green. Superb. The dashboard is a photographic plate. It is exquisitely sensitive across a narrow band that somebody chose, under budget pressure, some years ago, for reasons nobody currently employed can fully reconstruct. Outside that band its sensitivity is not low. It is zero. And a zero sensitivity instrument reporting nothing has told you precisely nothing, at high resolution, in real time, with a very reassuring colour palette.
This is the whole argument compressed - you cannot infer coverage from calm.
Astronomers are disciplined about this in a way that most organisations are not. When a radio survey finds nothing at a given position, the result is published as an upper limit, with the sensitivity, the integration time, the bandwidth and the beam size all stated. The null result is a quantitative claim about the instrument as much as about the sky. Now consider the last time a status report said we had no incidents, and ask what the stated sensitivity was. Nobody computed it. Nobody was asked to. We had no incidents and we detected no incidents were treated as the same sentence, and only one of them was true.
Where pulsars go to die
Detection depends on three things, and single-instrument programmes tend to fail at all three simultaneously.
Where you point. The obvious one. Off-band phenomena are not faint, they are absent. No amount of dashboard polish widens the passband.
How sensitively you integrate. Faint things need long exposures, and long exposures wash out anything that varies. Which brings us to the third and most quietly lethal failure.
How fast you sample. Average the Crab pulsar over a minute and you have measured a steady, unremarkable source. Every drop of structure - the thirty hertz beat that made it one of the most important objects in twentieth century physics - lives entirely in the variance you just discarded. Nyquist was not offering a suggestion.
Aggregation is the quiet killer, because it looks like rigour. Means, medians, monthly rollups, the single composite health score beloved of steering committees. Each one is an integration time. Each one deliberately destroys the high frequency structure in exchange for a smoother line. Your p50 latency is fine and always will be, in the same sense that the average depth of a river is a poor guide to whether you can walk across it. Simpson's paradox is not an exotic statistical curiosity, it is the default state of any sufficiently aggregated report, patiently waiting for someone to disaggregate and discover that the trend reverses in every single subgroup.
Goodhart's redshift
Here is where the astronomical analogy becomes too kind to us. The sky is indifferent. It does not rearrange itself to avoid our detectors.
Organisations do. Systems under optimisation pressure do. When one band is monitored and rewarded, effort, risk and pathology migrate to the bands that are not. This is Goodhart's law with a Doppler shift - the failure does not disappear, it moves to a frequency you are not equipped to receive. Response times improve while the thing being responded to gets quietly redefined. Test coverage climbs while the tests get shallower. Reported engagement rises as the product becomes more irritating to use. Nobody conspired. Gradient descent on a single visible metric is sufficient, and it will find the unmonitored bands faster than you can instrument them, because there are always more of them than there are of you.
Monitoring at one wavelength does not merely fail to see other bands. Over time it actively populates them.
In praise of ugly instrument parks
The alternative is genuinely worse to look at. A single pane of glass is elegant. A deliberately heterogeneous observation programme is a junkyard - mismatched tools, inconsistent units, arguments about which source to believe, and no possibility of one beautiful screen that answers everything.
Take the junkyard. The point of heterogeneity is not more coverage, it is uncorrelated blind spots. Two instruments with the same failure mode are one instrument with a redundant power supply. What you want are detectors that fail in unrelated ways, so that no single mechanism can produce silence across all of them at once.
Concretely, that means holding several kinds of observation in tension and refusing to collapse them into a composite.
- Quantitative and qualitative together. Numbers are calibrated and narrow. Humans are wideband, appallingly calibrated, and superb at the one thing no metric does, which is noticing that something is odd without having been told in advance what odd would look like. Support tickets, sales calls, the sentence "that is weird" muttered at a desk. This is your all sky monitor. Low resolution, always on, and the only thing likely to catch an event you had not designed a detector for.
- Sampled and aggregate together. Aggregates tell you the shape of the distribution. Individual traces, session recordings, five randomly chosen cases read end to end, one customer conversation transcribed in full - these preserve the high frequency structure that averaging exists to destroy. Read the individual case even when the aggregate looks fine. Especially then.
- Inside and outside together. Internal telemetry shares fate with the thing it observes. A monitoring system running in the cluster it monitors is a smoke detector wired to the same fuse as the fire. External probes, mystery shopping, an outsider walking the process cold.
- Leading and lagging together. Outcomes are the truth and they arrive late. Precursors are noisy and arrive early. Anyone who has picked only one has picked whether to be right or to be on time.
Add a serendipity budget. Some fraction of observational capacity aimed at nothing in particular, with no hypothesis to confirm and no metric attached, because the Vela satellites were not looking for gamma ray bursts and the CMB was found by a man trying to clean his antenna. Unallocated curiosity is not slack. It is your only instrument for detecting the categories you have not invented yet.
And the aspiration is multi-messenger. In August 2017 a gravitational wave detection, a short gamma ray burst, and then optical, infrared, ultraviolet, X-ray and radio follow-up all resolved to a single neutron star merger in a single galaxy. No individual band could have told that story. The events that matter most are usually the ones that only make sense across instruments, which is precisely why a monoculture of measurement will report them as a quiet week.
The residual you cannot clean away
There is one more habit worth stealing from Penzias and Wilson, and it is the hardest. When your instrument shows an anomaly you cannot explain, the first instinct is to clean the instrument. Usually the instinct is correct. The reading is wrong, the pigeons are real, the sensor is drifting, the query is broken. Most anomalies are artefacts and most artefacts should be scrubbed out.
But keep a note of the ones you scrub. Keep it in writing. Because occasionally the excess you cannot eliminate is not noise in your apparatus, it is the universe arriving on a wavelength you were never trying to observe, and the difference between a footnote and a Nobel Prize is whether anyone bothered to ask a third time.
The sky was never quiet. It was full of pulsars, quasars, bursts and the fading heat of the first light in existence, all of it pouring down without pause on generations of brilliant people looking very carefully in the wrong band and finding, reliably and honestly, nothing at all.
Their dashboards were green too.